Data Visualization with Tableau
by
(𝐃𝐫. 𝐒𝐚𝐦𝐞𝐞𝐫 𝐑𝐨𝐡𝐚𝐝𝐢𝐚)
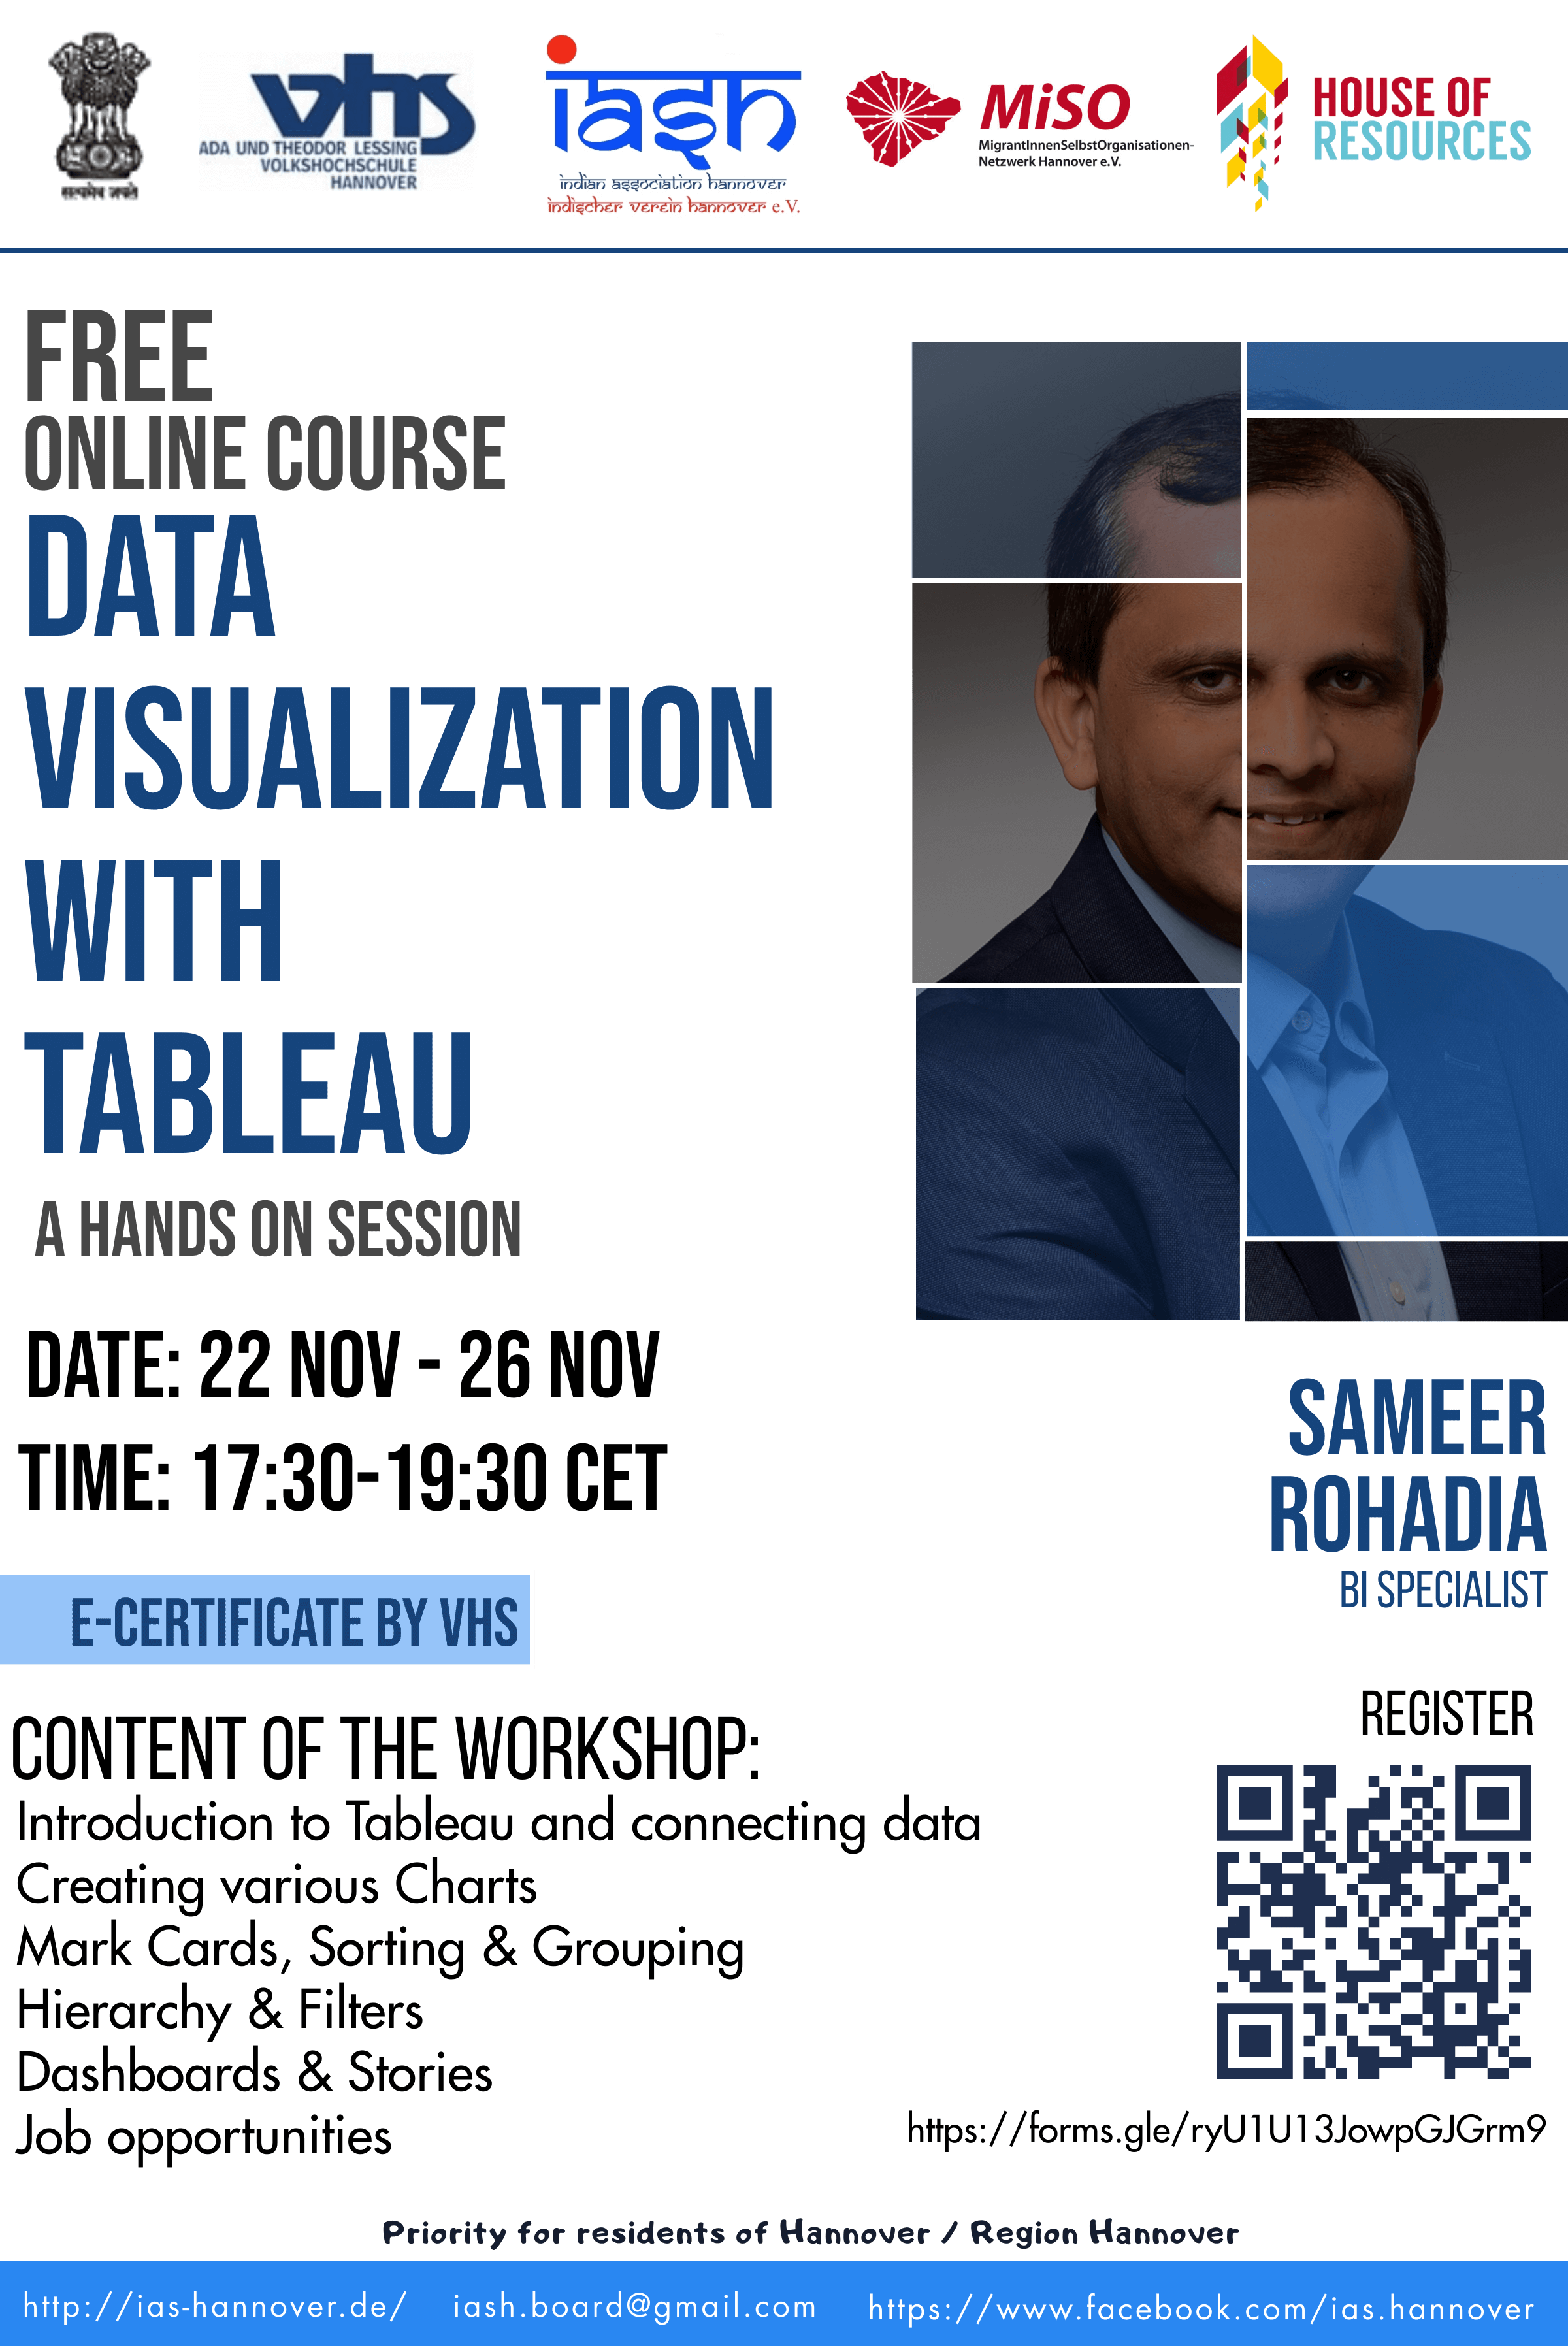
𝐃𝐚𝐭𝐞 : 22 Nov. 2021 – 26 Nov. 2021
𝐓𝐢𝐦𝐞: 17:30 -19:30 hr., CET (x5 sessions)
Event
Data Visualization with Tableau
Date
22 Nov. 2021 – 26 Nov. 2021
Venue
Online (VHS Cloud)
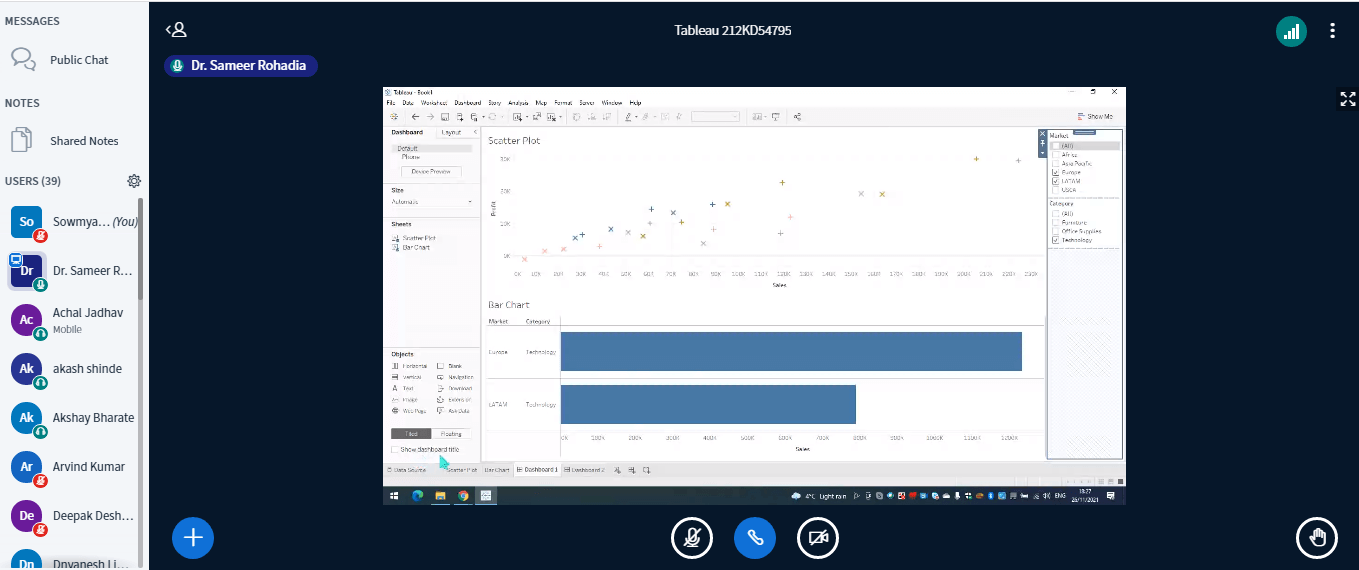
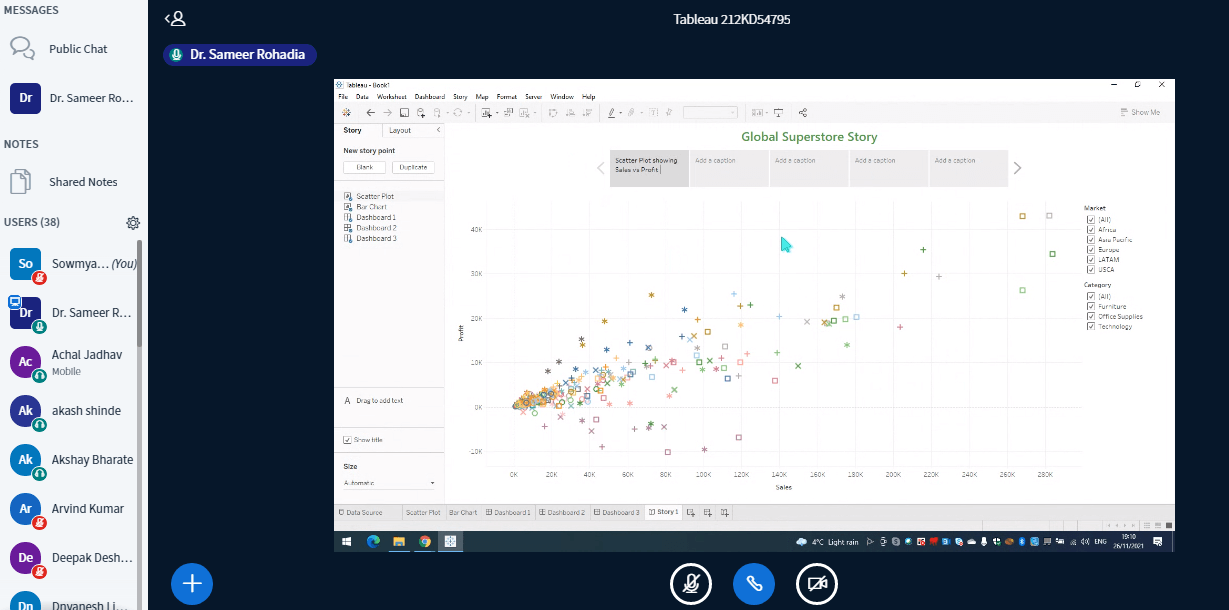
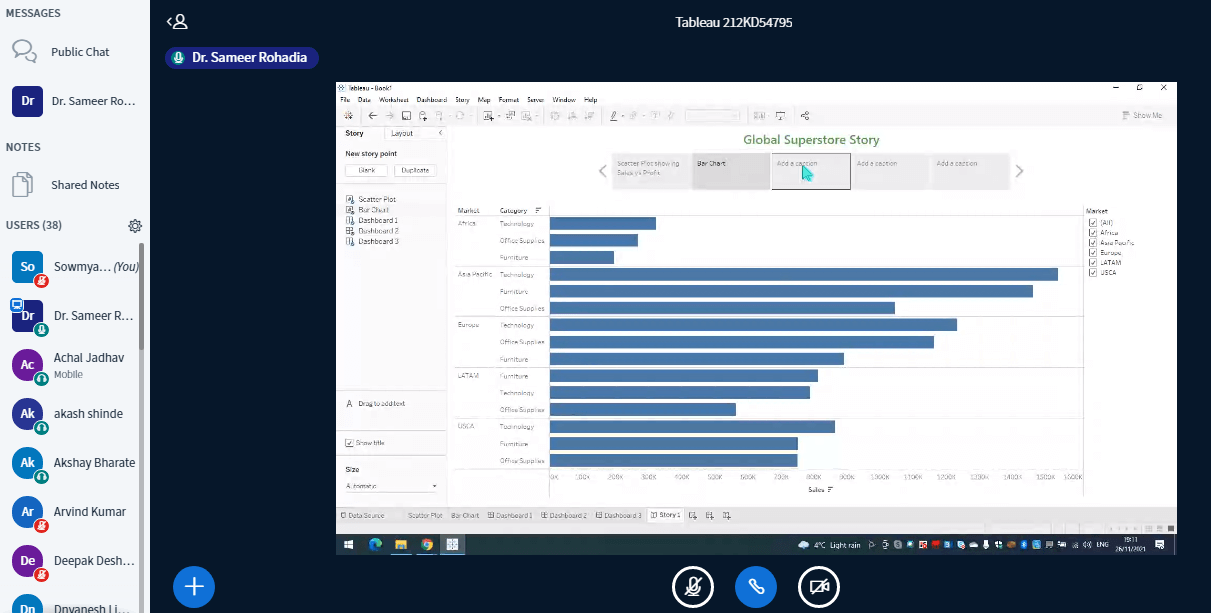
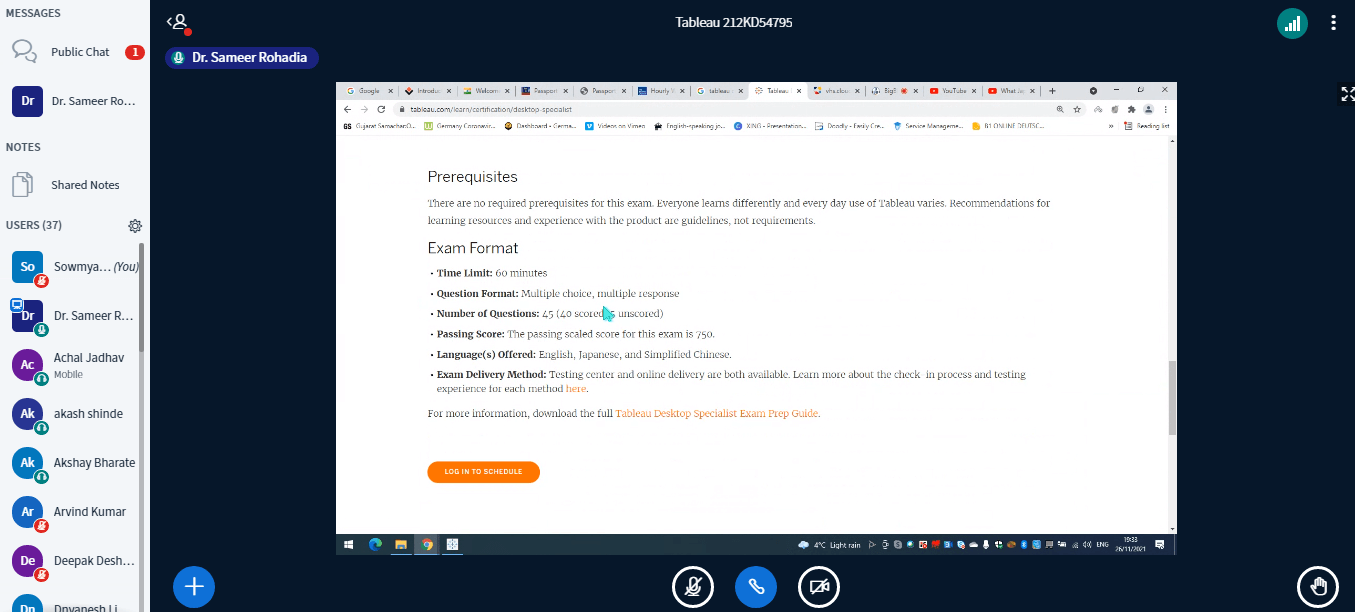
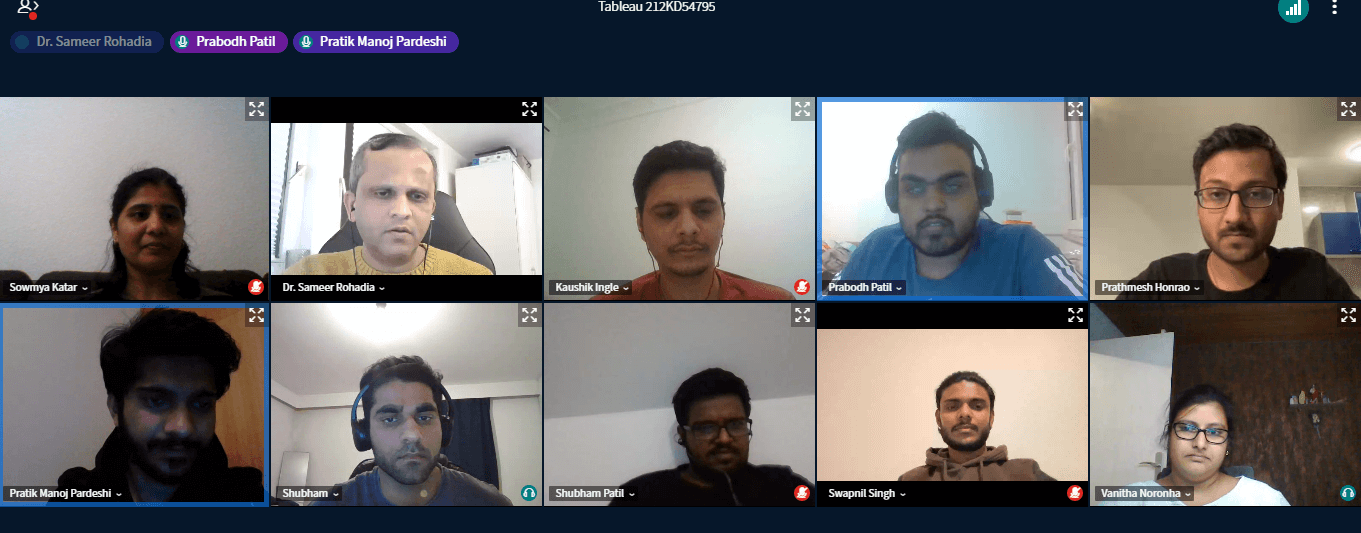
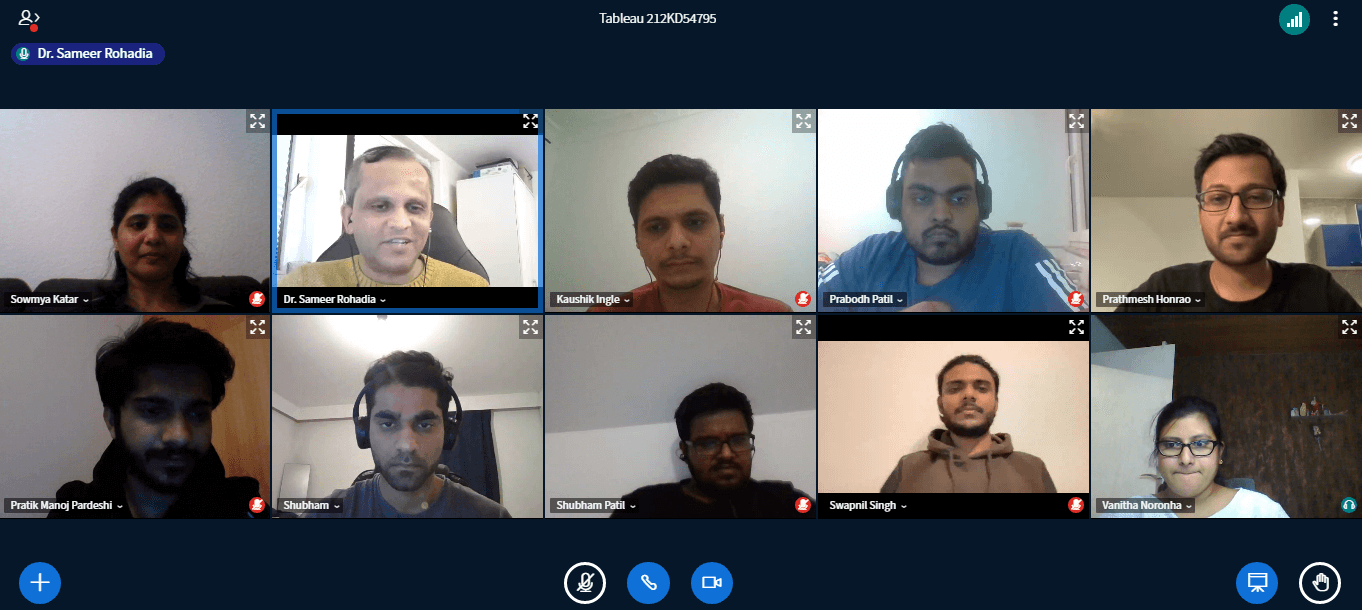
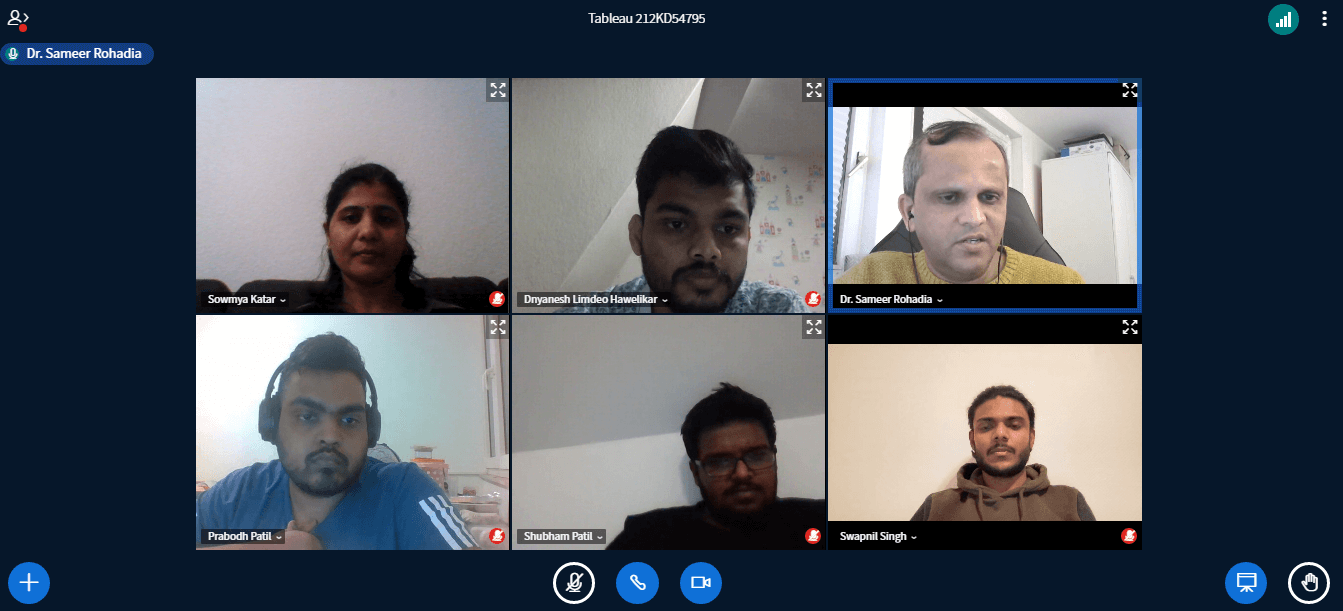
Indian Association Hannover in cooperation with MiSo / House of Resources, and Volkshochschule Hannover (VHS) organised a 𝐟𝐫𝐞𝐞 𝐨𝐧𝐥𝐢𝐧𝐞 𝐡𝐚𝐧𝐝𝐬 𝐨𝐧 𝐰𝐨𝐫𝐤𝐬𝐡𝐨𝐩 𝐨𝐧 𝐃𝐚𝐭𝐚 𝐕𝐢𝐬𝐮𝐚𝐥𝐢𝐳𝐚𝐭𝐢𝐨𝐧 𝐰𝐢𝐭𝐡 Tableau. After completion of online course, participants with 80% attendance received an 𝐄-𝐜𝐞𝐫𝐭𝐢𝐟𝐢𝐜𝐚𝐭𝐞 issued by Volkshochschule Hannover (VHS).
The Workshop is an introductory course on Tableau, one of the favorite data visualization tool used by many of the top 500 Companies.
𝐓𝐢𝐦𝐞: 17:30 -19:30 hr., CET (x5 sessions)
B𝐫𝐢𝐞𝐟 𝐩𝐫𝐨𝐟𝐢𝐥𝐞 𝐨𝐟 𝐭𝐫𝐚𝐢𝐧𝐞𝐫 (𝐃𝐫. 𝐒𝐚𝐦𝐞𝐞𝐫 𝐑𝐨𝐡𝐚𝐝𝐢𝐚):
Dr. Rohadia has 15 years of teaching experience at universities and 5 years of industry experience. His last assignment was with Continental AG, where he trained 1750+ worldwide colleagues on the topic of Big Data & Power BI through 34 Classroom training & Webinars. Currently, he is working as BI Specialist in Germany. He has conducted 70+ Webinars & Workshops and trained 6500+ industry professionals, faculty members & students in the area of Big Data, MS Power BI, Tableau and MS Excel.
Gallery